Are you looking for a fast and simple database management system for your data platform stack?
Recently, I was working on building a new Logs dashboard at Fossil to serve our internal team for log retrieval, and I found ClickHouse to be a very interesting and fast engine for this purpose. In this post, I’ll share my experience with using ClickHouse as the foundation of a light-weight data platform and how it compares to another popular choice, Athena. We’ll also explore how ClickHouse can be integrated with other tools such as Kafka to create a robust and efficient data pipeline.
ClickHouse?
ClickHouse is an open-source, distributed column-based database management system. It is designed to be highly performant and efficient, making it a great choice for data-intensive workloads. Compared to traditional relational databases, ClickHouse can query large datasets in seconds, making it perfect for analytics, machine learning, and other big data applications. With its comprehensive set of features and scalability, ClickHouse is a great choice for powering your data platform stack.
The MergeTree engine is one of the core features of ClickHouse and is the foundation of its scalability and performance. It is used to store data in distributed clusters and is able to efficiently query large datasets in a fraction of the time compared to traditional relational databases. Furthermore, the MergeTree engine is designed to provide high availability and fault-tolerance, ensuring that your data remains safe and secure even in the event of a failure.
CREATE TABLE raw_events (
  event_time DateTime,
  event_id String,
  data String
) ENGINE = MergeTree()
PARTITION BY toYYYYMM(event_time)
ORDER BY event_time
TTL event_time + INTERVAL 180 DAY
You can explore ClickHouse using the Playground without setting up by visiting https://play.clickhouse.com/play.
Streamline Your Data Pipeline with ClickHouse
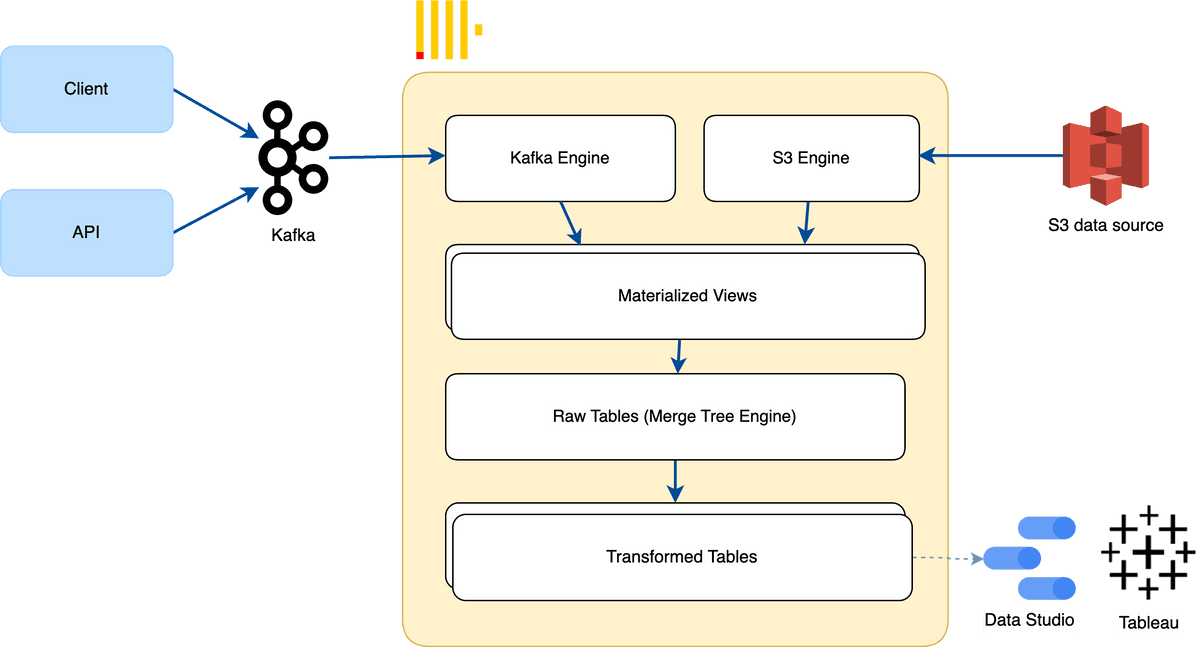
ClickHouse can be integrated with other popular tools such as Apache Kafka and other data sources (Postgres, S3, MongoDB, …) to create a powerful and efficient data pipeline. By leveraging the power of these sources, data can be ingested, transformed, and stored in ClickHouse quickly and easily. Furthermore, ClickHouse can be used to analyze the data in real-time, giving you access to a wide range of analytics without the need for complex ETL processes. With its comprehensive set of features and scalability, ClickHouse is a great choice for powering your data platform stack.
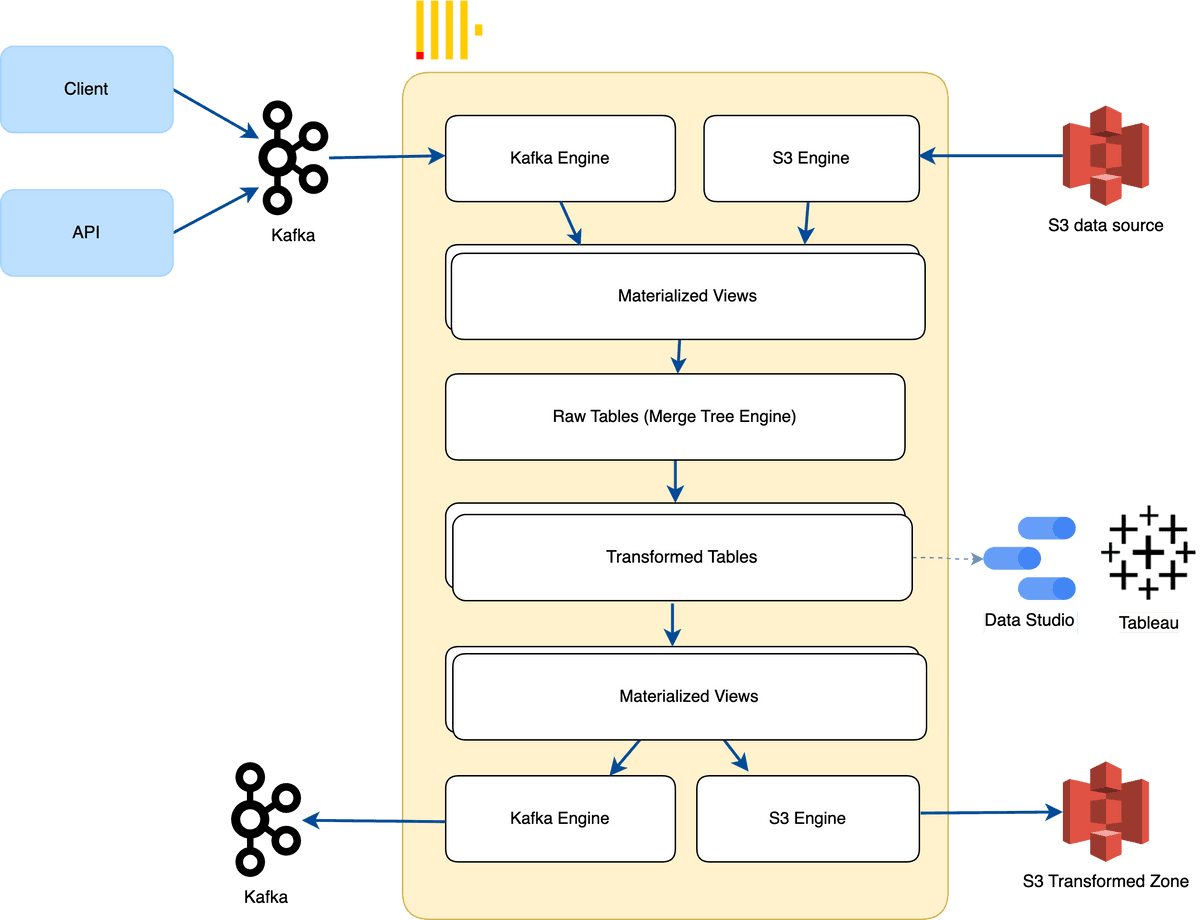
The architecture design we have shown above provides an example of how ClickHouse can be integrated with Kafka to create an efficient data pipeline.
Here are the queries to create the kafka_table that connect to the Kafka topic:
CREATE TABLE kafka_table (
  event_time DateTime,
  event_id UInt64,
  json String
)
ENGINE = Kafka
SETTINGS
	kafka_broker_list = 'localhost:9092',
	kafka_topic_list = 'events',
	kafka_group_name = 'clickhouse_consumer_group',
	kafka_format = 'JSONEachRow';
To store the events data from Kafka to ClickHouse, I create a table using MergeTree table engine. The table has three columns: an event_time column of type DateTime, an event_id column of type String, and a data column of type String.
CREATE TABLE raw_events (
  event_time DateTime,
  event_id String,
  data String
) ENGINE = MergeTree()
PARTITION BY toYYYYMM(event_time)
ORDER BY event_time
After that, create the Materialized View called kafka_to_clickhouse
CREATE MATERIALIZED VIEW kafka_to_clickhouse
TO raw_events
AS SELECT * FROM kafka_table
It captures data from the kafka_table table and inserts it into the raw_events table. This allows you to persist the data being consumed from Kafka and store it in a table for further processing or analysis. It acts as a view that you can query just like any other table. This means that you can perform SELECT queries on the Materialized View to retrieve the data that has been captured from Kafka and stored in the raw_data table. For example:
SELECT * FROM kafka_to_clickhouseYou can also take advantage of ClickHouse’s powerful SQL capabilities to query the data stored in the raw_events table. For example, you can use the WHERE clause to filter the data based on specific criteria.
SELECT * FROM raw_events
WHERE event_time > '2020-01-01'
AND event_name = 'pageview'
You can also use the GROUP BY clause to group the data by particular columns.
SELECT page_id, COUNT(*) AS page_views
FROM raw_events
WHERE
	event_time > '2020-01-01'
	AND event_name = 'pageview'
GROUP BY page_id
By leveraging the power of ClickHouse’s SQL capabilities, you can quickly and easily query the data stored in the raw_events table. This makes it easy to extract insights from your data and create powerful visuals for your dashboard.
Data transformation using built-in materialized view
ClickHouse also offers a powerful feature called Materialized view which allows users to transform data on the fly. This can be used to quickly create tables and views from existing data sources, or to join multiple tables together. This feature is incredibly powerful and can be used to quickly and easily create complex queries without the need to write complex SQL. By leveraging the power of ClickHouse’s Materialized view feature, you can streamline your data pipeline and ensure that your data is always up to date.
CREATE TABLE transformed_data (
  event_time DateTime,
  event_id String,
  user_id String,
  page_id String,
  event_name String,
  event_value Float64
) ENGINE = MergeTree()

CREATE MATERIALIZED VIEW transform_view
TO transformed_data
AS SELECT
  event_time,
  event_id,
  JSONExtractString('user_id', json) AS user_id,
  JSONExtractString('page_id', json) AS page_id,
  JSONExtractString('event_name', json) AS event_name,
  JSONExtractFloat64('event_value', json) AS event_value
FROM raw_events
The Materialized View called transform_view uses the JSONExtractString() and JSONExtractFloat64() functions to extract the user_id, page_id, event_name, and event_value fields from the JSON string in the raw_events table, and inserts them into the corresponding columns in the transformed_data table.
You can then query the transformed_data table just like any other table:
SELECT * FROM transformed_dataSo as the example above, you can use ClickHouse to transform and model your raw data into tables of your Data Warehouse (DWH), simply by using the MaterializedView without external tools like Spark or DBT. ClickHouse also supports additional engines in the MergeTree family, such as ReplacingMergeTree, GroupingMergeTree, and more.
ClickHouse to Kafka / S3 / External Database
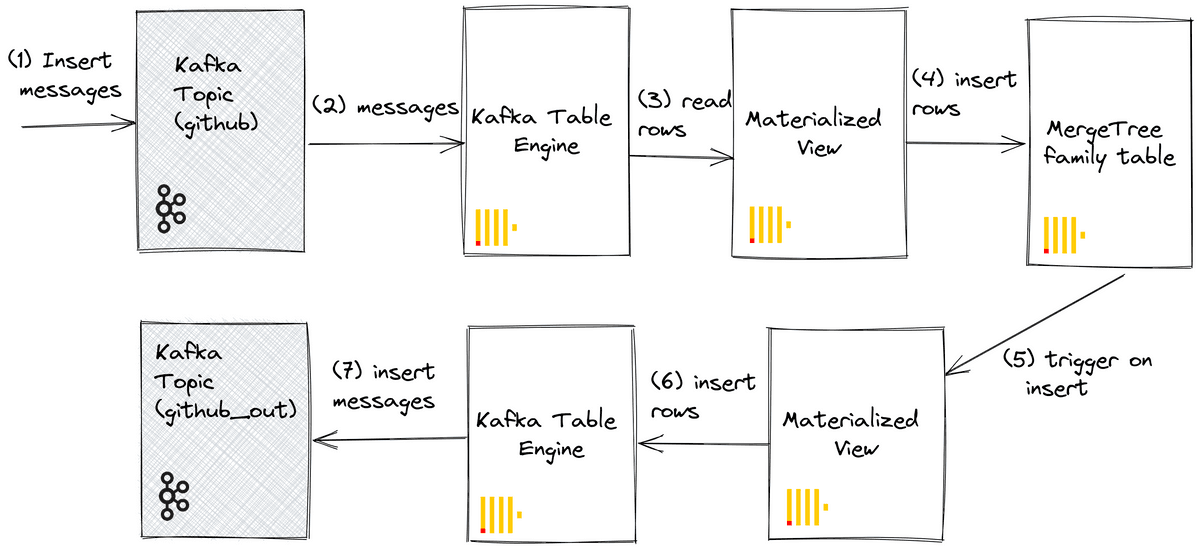
At Transformed Tables, your tables can now be used by BI tools (Tableau, Grafana, Metabase, …), extracted or exported to S3, another database like Redshift, or even published to other Kafka topics to make them available to other components.
With the S3 Table Engine, we can export data from ClickHouse to S3 in the following way:
CREATE TABLE s3_transformed_data (event_id String, user_id String, page_id String)
ENGINE = S3('https://duyet-dwh.s3.amazonaws.com/dwh/some_file_{1..30}', 'CSV');
You can follow the detailed official document here to integrate Kafka with ClickHouse and ClickHouse with Kafka: https://clickhouse.com/docs/en/integrations/kafka/kafka-table-engine.
RelicatedMergeTree Engine and Distributed table engine
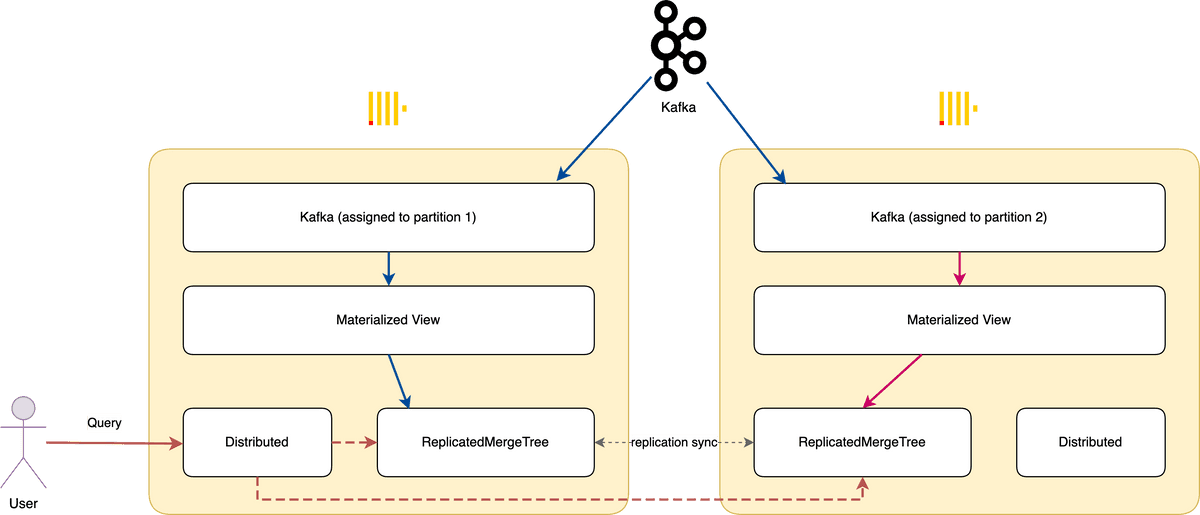
ClickHouse also makes use of two other advanced features to improve its scalability and performance: the RelicatedMergeTree engine and
the Distributed table engine. The RelicatedMergeTree engine is a distributed version of the MergeTree engine that allows for data to be stored in multiple clusters.
This allows for increased scalability and performance, making it perfect for large datasets. On the other hand, the Distributed table engine allows for data to be stored in multiple tables, making it easier to manage and query large datasets.
Conclusion
In conclusion, ClickHouse is a powerful and efficient data platform that can easily be integrated with other tools such as Apache Kafka and other data sources to create a powerful and efficient data pipeline. Through its advanced features such as MergeTree, ReplicatedMergeTree, and Distributed table engine, ClickHouse can handle large datasets with ease, allowing you to quickly and easily extract insights from your data and create powerful visuals for your dashboard.
I hope this helps. Was this a good idea? Please let me know.


